Women’s Basketball: Oregon Ducks Pace-adjusted Stats
With Big Ten play now in full swing for both basketball teams, I decided to take a look as some advanced stats for each contributing players’ performance so far. While the box scores can be informative, most experts agree that pace-adjusted stats more accurately reflect a player’s overall abilities.
Below are three tables with advanced statistics for each of the women’s major contributors (players with fewer than 50 minutes on the floor so far this season have been censored), courtesy of sports-reference.com. All of these numbers are based on pace-of-play adjusted season averages per-100 possessions. I have included a brief glossary of these terms below. For full formulas and links to more detailed explanations for each of these statistics, please see basketball-reference.com.
G — Games
GS — Games Started
MP — Minutes Played
PER — Player Efficiency Rating
An overall measure of a player’s effectiveness on the court, adjusting for pace of play. The ratings are adjusted so that the average for all Div-1 men’s basketball is 15.
USG% — Usage Percentage
An estimate of the percentage of team plays used by a player while they were on the floor.
WS/40 — Win Shares Per 40 Minutes
An estimate of the number of wins contributed by a player per 40 minutes (average is approximately .100).
BPM — Box Plus/Minus
A box score estimate of the points per 100 possessions a player contributed above a league-average player, translated to an average team.
UO WBB Overall Advanced Stats
| Player | Num | Pos | G | GS | MP | PER | USG% | WS/40 | BPM |
|---|---|---|---|---|---|---|---|---|---|
| Player | Num | Pos | G | GS | MP | PER | USG% | WS/40 | BPM |
| Deja Kelly | 25 | G | 17 | 17 | 516 | 16.1 | 22.6 | 0.142 | 5.7 |
| Peyton Scott | 10 | G | 15 | 15 | 375 | 17.9 | 22.2 | 0.173 | 6.7 |
| Amina Muhammad | 5 | F | 17 | 15 | 369 | 20.9 | 19.7 | 0.198 | 7.7 |
| Elisa Mevius | 8 | G | 17 | 9 | 353 | 21.8 | 17.7 | 0.201 | 10.7 |
| Nani Falatea | 4 | G | 17 | 3 | 339 | 18.9 | 18.7 | 0.183 | 10.4 |
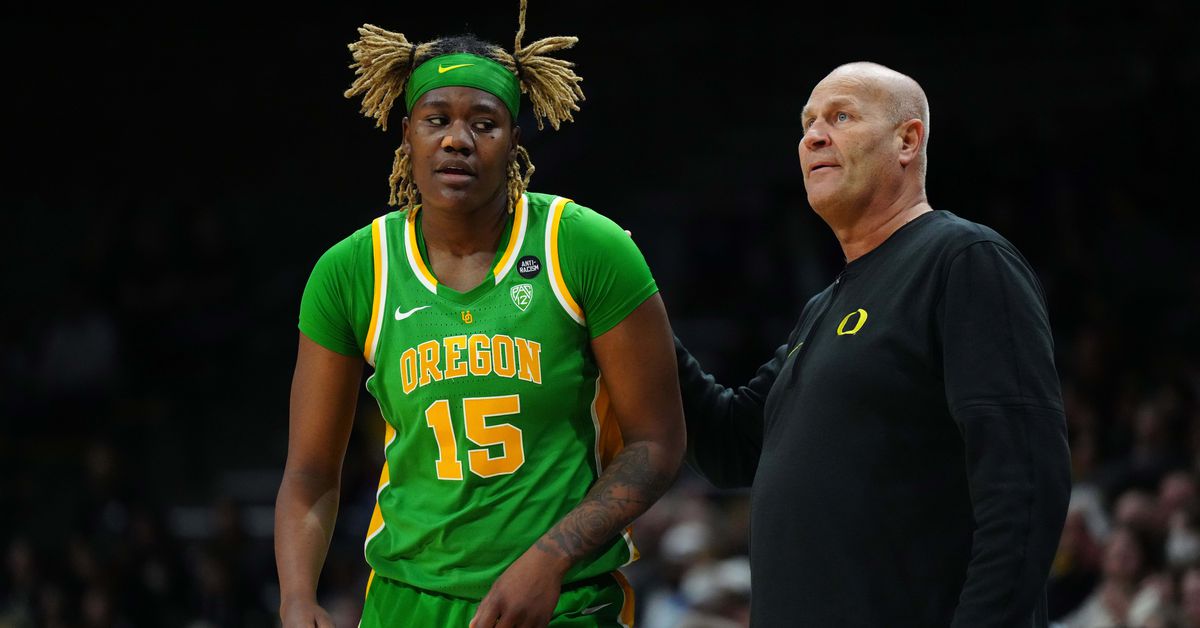
| Phillipina Kyei | 15 | C | 17 | 10 | 289 | 23.9 | 21.4 | 0.213 | 8.1 |
| Alexis Whitfield | 1 | F | 17 | 7 | 275 | 19.9 | 18.7 | 0.185 | 8.7 |
| Sofia Bell | 3 | G | 13 | 7 | 261 | 7.9 | 14.4 | 0.081 | 4.4 |
| Sarah Rambus | 23 | F | 17 | 1 | 220 | 13.4 | 21.2 | 0.117 | 1 |
| Katie Fiso | 2 | G | 14 | 0 | 140 | 7.4 | 24.2 | 0.04 | -1.7 |
| Ari Long | 14 | G | 14 | 0 | 136 | 16.6 | 16.8 | 0.177 | 8.8 |
| Ehis Etute | 35 | F | 10 | 1 | 107 | 24.6 | 21.6 | 0.224 | 9 |
Taking a more granular look, we can examine some stats used specifically for offensive performance.
TS% — True Shooting Percentage
A measure of shooting efficiency that takes into account 2-point field goals, 3-point field goals, and free throws.
eFG% — Effective Field Goal Percentage
This statistic adjusts for the fact that a 3-point field goal is worth one more point than a 2-point field goal.
3PAr — 3-Point Attempt Rate
Percentage of FG Attempts from 3-Point Range
FTr — Free Throw Attempt Rate
Number of FT Attempts Per FG Attempt
PProd — Points Produced
An estimate of the player’s offensive points produced.
ORB% — Offensive Rebound Percentage
An estimate of the percentage of available offensive rebounds a player grabbed while they were on the floor.
TOV% — Turnover Percentage
An estimate of turnovers per 100 plays.
AST% — Assist Percentage
An estimate of the percentage of teammate field goals a player assisted while they were on the floor.
UO WBB Offensive Advanced Stats
| Player | Num | Pos | TS% | eFG% | 3PAr | FTr | PProd | ORB% | TOV% | AST% |
|---|---|---|---|---|---|---|---|---|---|---|
| Player | Num | Pos | TS% | eFG% | 3PAr | FTr | PProd | ORB% | TOV% | AST% |
| Deja Kelly | 25 | G | 0.426 | 0.41 | 0.186 | 0.181 | 189 | 1.5 | 11.5 | 22.3 |
| Peyton Scott | 10 | G | 0.539 | 0.476 | 0.389 | 0.373 | 148 | 1.8 | 14.9 | 12.8 |
| Amina Muhammad | 5 | F | 0.578 | 0.583 | 0 | 0.407 | 140 | 10.6 | 15.1 | 7.1 |
| Elisa Mevius | 8 | G | 0.595 | 0.567 | 0.438 | 0.202 | 131 | 6.3 | 25.3 | 27 |
| Nani Falatea | 4 | G | 0.555 | 0.542 | 0.546 | 0.25 | 119 | 1.3 | 9 | 12.1 |
| Phillipina Kyei | 15 | C | 0.522 | 0.5 | 0 | 0.255 | 119 | 15.9 | 18.5 | 12.8 |
| Alexis Whitfield | 1 | F | 0.534 | 0.517 | 0.149 | 0.115 | 93 | 5.3 | 14.8 | 12.7 |
| Sofia Bell | 3 | G | 0.432 | 0.408 | 0.9 | 0.167 | 53 | 1.3 | 17.8 | 7.2 |
| Sarah Rambus | 23 | F | 0.575 | 0.559 | 0 | 0.407 | 75 | 5.6 | 27.7 | 9.1 |
| Katie Fiso | 2 | G | 0.398 | 0.38 | 0.333 | 0.148 | 45 | 2.4 | 18.4 | 13.9 |
| Ari Long | 14 | G | 0.402 | 0.366 | 0.659 | 0.195 | 37 | 1.6 | 6.3 | 13.3 |
| Ehis Etute | 35 | F | 0.604 | 0.563 | 0 | 0.344 | 46 | 15.7 | 22.8 | 10.5 |
Defensive performance is more difficult to measure using box scores, but there are a few notable statistics that are components of the overall effectiveness measures shown in the first table.
DRB% — Defensive Rebound Percentage
An estimate of the percentage of available defensive rebounds a player grabbed while they were on the floor.
STL% — Steal Percentage
An estimate of the percentage of opponent possessions that end with a steal by the player while they were on the floor.
BLK% — Block Percentage
An estimate of the percentage of opponent two-point field goal attempts blocked by the player while they were on the floor.
UO WBB Defensive Advanced Stats
| Player | Num | Pos | DRB% | STL% | BLK% |
|---|---|---|---|---|---|
| Player | Num | Pos | DRB% | STL% | BLK% |
| Deja Kelly | 25 | G | 15.9 | 2.6 | 0 |
| Peyton Scott | 10 | G | 9.4 | 2.1 | 0 |
| Amina Muhammad | 5 | F | 10.5 | 3.2 | 0.6 |
| Elisa Mevius | 8 | G | 11.3 | 4.4 | 0 |
| Nani Falatea | 4 | G | 7.5 | 2.1 | 0.6 |
| Phillipina Kyei | 15 | C | 23.7 | 2.1 | 5.7 |
| Alexis Whitfield | 1 | F | 14.9 | 3.6 | 2.3 |
| Sofia Bell | 3 | G | 7.2 | 3.2 | 0.4 |
| Sarah Rambus | 23 | F | 14.6 | 1 | 5.6 |
| Katie Fiso | 2 | G | 7.9 | 1.2 | 1.5 |
| Ari Long | 14 | G | 23.6 | 4.9 | 2.3 |
| Ehis Etute | 35 | F | 16.5 | 3.6 | 1 |
What to make of all of these numbers? The first thing to note is that many of the advanced stats have notably different ranges depending on the role a given player is used in on the court. “Bigs” (centers and power forwards) tend to show up in the box score more often and thus tend to have higher PER and BPM scores. Higher minutes on the floor and usage percentage also makes it harder to maintain high scores in PER and BPM.
The first thing that jumps out just looking at the PER and BPM numbers is that this year’s squad is light year’s ahead of the roster Oregon had last season. This squad goes 7 deep in above average players according to PER, whereas last year’s starters didn’t all beat the mean score of 15. There are also far more scoring options, with eFG% at 0.500 or better among five of the seven most regular contributors. Indeed, the only shooters from the floor who fall below this mark are the guards who are responsible for distributing the ball. This explains the low PER scores for Kelly and Scott, but their value instead comes from ball handling and can be seen in their high PProd, USG%, and low TOV %.
Based on these performance metrics, Coach graves is using his roster in a rational manner. The Ducks have five quality starters with two reliable alternates. Rambus and Bell aren’t contributing many points but have value in relief based on their ability to play defense. While Long and Etute may seem underused based on some of their metrics, I would caution their low minutes played makes their numbers less reliable than their team mates.
Based on these performance metrics and overall depth, I would not expect this team to challenge the most elite competition in a tough Big Ten conference. Given the nadir of last year’s ultimate Pac-12 Season however, a middle of the pack conference finish would be gratifying progress.
As with the men, I am just starting to see more of this team in live competition. How do these numbers compare to your observations of the team so far this season? Let us know in the comments below.
Share this content:
Author: Hey PDX
Hey PDX Team


Post Comment