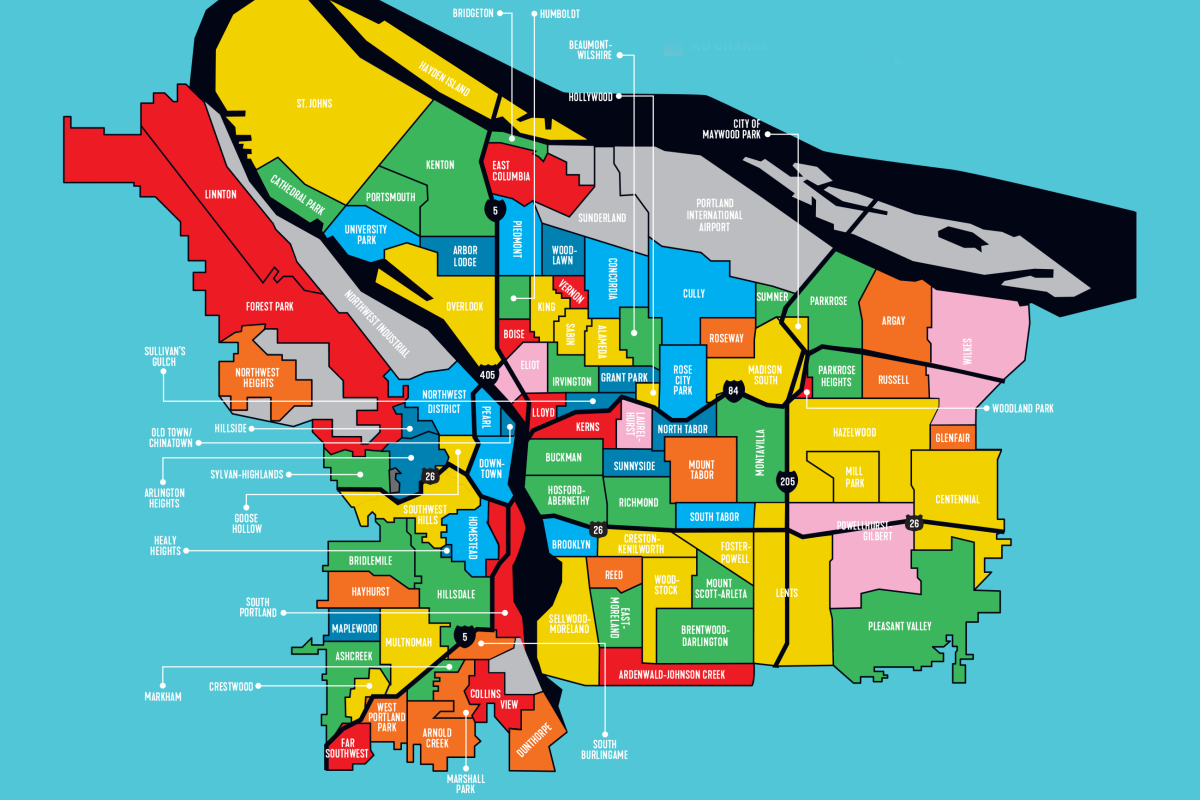
Portland’s Neighborhoods by the Numbers | Real Estate Market 2025

Was the past year in Portland real estate a sellers’ market? A buyers’ market? A market at all? In Portland and its suburbs, the number of homes sold was about the same as the year before, suggesting the pandemic-inspired life resets have mellowed compared to the flurry of moves between 2020 and 2022. Another sign of the non-frenzy? The average number of days Portland listings stayed on the market rose to 43, a whole week longer than the previous year.
A few other observations:
- Close-in condos calling? Prices are lower in Old Town and Sullivan’s Gulch.
- In a rush? Homes sold fastest last year in Sabin, Markham, Buckman, and Concordia.
- Why move? Crestwood, Ashcreek, and Arnold Creek had the highest rates of staying put in 2024.
- Room to roam: Recent sales in Dunthorpe and Forest Park have the most square footage.
- Half the population of Hayden Island, Far Southwest, Russell, and Arlington Heights are age 50 or older.
- University Park and Kerns have the highest bike commuting rates on Portland’s east side.
Looking for other specifics about Portland neighborhoods? Check out the details below.
| Neighborhood | Median 2024 home sale price ($) | Average 2024 home sale price ($) | Homes sold in 2024 (#) | 1-year median price change 2023-24 (%) | 5-year median price change 2019-24 (%) | Average days on market | Share of 2024 sales that were condos (%) | Short sales | Bank-owned sales | Average square feet of homes sold | Average cost per square foot ($) | Renters’ median monthly housing ($) | Population (2023) | Population (2022) | Population change by number of people, 2022 to 2023 | Population change by %, 2022 to 2023 | Population density (people per square mile) | Median age | Median household income ($) | Homeownership (%) | People below federal poverty level (%) | Unemployed rate (%) | Households with children under 18 (%) | Married (except separated) (%) | Widowed (%) | Divorced (%) | Separated (%) | Never married (%) | Population over 25, highest degree is a bachelor’s (%) | Speak only English (%) | Speak a language other than English (%) | Population in same house a year before (%) | Moved within the last year, from the same county (%) | Moved within the last year, from a different Oregon county (%) | Moved within the last year, from a different state (%) | Moved from abroad within the last year (%) | Area in square miles | Parks as % of neighborhood | Commuting by walking (%) | Commuting by public transit (%) | Commuting by bike (%) | Bus Stops | Bus Lines | Rail Stops | Rail Lines | Miles of Bike Routes | Walk Score |
|---|---|---|---|---|---|---|---|---|---|---|---|---|---|---|---|---|---|---|---|---|---|---|---|---|---|---|---|---|---|---|---|---|---|---|---|---|---|---|---|---|---|---|---|---|---|---|---|
| ALAMEDA | 899,500 | 904,487 | 63 | 1 | 21 | 26 | 2 | 0 | 1 | 2,830 | 324 | 2,712 | 5,591 | 5,816 | -225 | -4 | 9,368 | 44 | 175,711 | 79 | 4 | 8 | 31 | 65 | 3 | 6 | 1 | 26 | 37 | 93 | 7 | 90 | 7 | 1 | 2 | 0 | 0.6 | 0 | 3 | 4 | 2 | 38 | 3 | 0 | 0 | 4 | 64 |
| ARBOR LODGE | 475,000 | 482,263 | 93 | -13 | 0 | 39 | 25 | 0 | 1 | 1,574 | 325 | 1,916 | 7,165 | 7,490 | -325 | -4 | 8,259 | 38 | 119,349 | 68 | 8 | 5 | 21 | 44 | 3 | 10 | 0 | 43 | 41 | 90 | 10 | 83 | 12 | 2 | 3 | 1 | 0.9 | 2 | 4 | 3 | 2 | 35 | 5 | 2 | 1 | 10 | 79 |
| ARDENWALD-JOHNSON CREEK | 648,500 | 666,738 | 8 | 24 | 40 | 108 | 0 | 0 | 0 | 2,083 | 340 | 2,207 | 2,053 | 2,080 | -27 | -1 | 6,108 | 42 | 169,388 | 83 | 6 | 4 | 35 | 56 | 4 | 11 | 1 | 29 | 33 | 90 | 10 | 85 | 8 | 4 | 2 | 0 | 0.3 | 17 | 2 | 3 | 2 | 13 | 4 | 1 | 1 | 3 | 57 |
| ARGAY | 497,500 | 520,793 | 46 | 5 | 34 | 34 | 2 | 0 | 0 | 2,132 | 258 | 1,555 | 5,735 | 5,731 | 4 | 0 | 2,794 | 41 | 56,770 | 57 | 23 | 9 | 30 | 29 | 5 | 16 | 3 | 46 | 13 | 74 | 26 | 76 | 11 | 9 | 4 | 0 | 2.1 | 5 | 7 | 0 | 6 | 58 | 5 | 0 | 0 | 8 | 44 |
| ARLINGTON HEIGHTS | 1,144,000 | 1,257,009 | 11 | -12 | 32 | 25 | 0 | 0 | 0 | 3,482 | 377 | 1,410 | 2,124 | 2,160 | -37 | -2 | 2,601 | 50 | 173,783 | 79 | 6 | 5 | 20 | 65 | 1 | 5 | 0 | 28 | 36 | 88 | 12 | 82 | 11 | 3 | 2 | 1 | 0.8 | 63 | 2 | 1 | 10 | 20 | 5 | 1 | 2 | 4 | 35 |
| ARNOLD CREEK | 899,000 | 930,316 | 37 | 6 | 47 | 49 | 0 | 0 | 0 | 3,088 | 314 | 1,877 | 3,017 | 3,037 | -21 | -1 | 2,753 | 44 | 162,691 | 90 | 3 | 2 | 36 | 67 | 5 | 9 | 0 | 20 | 39 | 85 | 15 | 92 | 5 | 1 | 2 | 0 | 1.1 | 3 | 0 | 1 | 0 | 33 | 2 | 0 | 0 | 4 | 20 |
| ASHCREEK | 594,000 | 630,367 | 63 | -4 | 26 | 30 | 0 | 0 | 0 | 1,950 | 344 | 1,601 | 5,175 | 5,300 | -126 | -2 | 4,337 | 43 | 139,188 | 85 | 4 | 4 | 28 | 58 | 4 | 12 | 1 | 25 | 40 | 90 | 10 | 94 | 3 | 2 | 1 | 0 | 1.2 | 2 | 4 | 1 | 0 | 37 | 6 | 0 | 0 | 5 | 35 |
| BEAUMONT-WILSHIRE | 722,500 | 759,970 | 91 | -3 | 13 | 31 | 10 | 0 | 0 | 2,256 | 352 | 1,893 | 5,949 | 6,280 | -331 | -5 | 7,812 | 46 | 126,216 | 89 | 5 | 4 | 32 | 60 | 3 | 10 | 1 | 27 | 38 | 92 | 8 | 92 | 5 | 0 | 2 | 0 | 0.8 | 3 | 2 | 5 | 3 | 35 | 3 | 0 | 0 | 6 | 78 |
| BOISE | 612,000 | 611,347 | 33 | 10 | 15 | 58 | 12 | 0 | 0 | 2,051 | 321 | 1,806 | 5,439 | 5,183 | 255 | 5 | 12,712 | 34 | 95,507 | 30 | 15 | 7 | 15 | 26 | 2 | 13 | 1 | 59 | 42 | 86 | 14 | 75 | 13 | 4 | 6 | 2 | 0.4 | 2 | 11 | 6 | 4 | 24 | 7 | 0 | 1 | 4 | 93 |
| BRENTWOOD-DARLINGTON | 415,000 | 425,018 | 196 | -1 | 24 | 34 | 15 | 0 | 1 | 1,363 | 335 | 1,706 | 12,767 | 12,759 | 8 | 0 | 7,343 | 37 | 79,903 | 70 | 14 | 4 | 34 | 42 | 4 | 15 | 1 | 38 | 24 | 80 | 20 | 87 | 5 | 5 | 3 | 0 | 1.7 | 4 | 6 | 4 | 3 | 67 | 4 | 0 | 0 | 9 | 65 |
| BRIDGETON | 350,000 | 366,375 | 16 | -1 | 20 | 118 | 0 | 0 | 1 | 1,476 | 260 | 1,737 | 74 | 69 | 5 | 7 | 273 | 41 | 85,938 | 61 | 15 | 2 | 24 | 40 | 3 | 17 | 1 | 40 | 32 | 66 | 35 | 82 | 10 | 1 | 6 | 0 | 0.3 | 1 | 6 | 1 | 0 | 4 | 2 | 0 | 0 | 4 | 22 |
| BRIDLEMILE* | 825,000 | 862,273 | 59 | -4 | 32 | 36 | 2 | 0 | 0 | 2,608 | 358 | 1,677 | 4,779 | 4,969 | -190 | -4 | 4,090 | 40 | 129,473 | 70 | 8 | 4 | 35 | 57 | 5 | 11 | 0 | 27 | 38 | 88 | 12 | 90 | 4 | 2 | 3 | 1 | 1.2 | 4 | 4 | 1 | 0 | 52 | 4 | 0 | 0 | 3 | 41 |
| BROOKLYN | 506,000 | 512,587 | 30 | -8 | 11 | 63 | 7 | 0 | 0 | 1,831 | 305 | 1,723 | 7,223 | 6,934 | 289 | 4 | 4,208 | 40 | 93,886 | 50 | 9 | 8 | 21 | 41 | 2 | 12 | 1 | 44 | 35 | 91 | 9 | 82 | 8 | 2 | 7 | 0 | 1.7 | 6 | 7 | 9 | 7 | 25 | 6 | 2 | 1 | 7 | 82 |
| BUCKMAN | 643,775 | 635,707 | 34 | -2 | 15 | 21 | 15 | 0 | 0 | 2,319 | 295 | 1,518 | 9,726 | 9,803 | -77 | -1 | 8,429 | 35 | 66,397 | 10 | 17 | 6 | 3 | 20 | 1 | 15 | 2 | 62 | 39 | 90 | 10 | 67 | 18 | 5 | 9 | 1 | 1.2 | 2 | 10 | 6 | 9 | 59 | 8 | 9 | 2 | 13 | 92 |
| CATHEDRAL PARK | 368,000 | 416,412 | 61 | -1 | -5 | 37 | 44 | 0 | 1 | 1,403 | 312 | 1,592 | 4,737 | 4,840 | -103 | -2 | 4,619 | 39 | 75,349 | 54 | 12 | 4 | 17 | 28 | 5 | 14 | 2 | 51 | 36 | 89 | 11 | 81 | 13 | 2 | 3 | 0 | 1.0 | 10 | 6 | 2 | 2 | 22 | 4 | 0 | 0 | 3 | 80 |
| CENTENNIAL | 400,000 | 386,984 | 218 | 1 | 30 | 44 | 7 | 2 | 4 | 1,505 | 274 | 1,404 | 23,444 | 24,046 | -602 | -3 | 7,194 | 39 | 64,863 | 61 | 18 | 7 | 34 | 43 | 5 | 12 | 2 | 38 | 11 | 68 | 32 | 86 | 9 | 2 | 3 | 0 | 3.3 | 4 | 7 | 1 | 1 | 56 | 4 | 0 | 0 | 15 | 58 |
| COLLINS VIEW | 765,500 | 770,192 | 26 | 16 | 44 | 24 | 0 | 0 | 0 | 2,300 | 361 | 1,974 | 1,519 | 1,502 | 16 | 1 | 1,748 | 33 | 158,907 | 91 | 3 | 4 | 34 | 48 | 2 | 5 | 0 | 44 | 43 | 88 | 12 | 85 | 4 | 3 | 7 | 0 | 0.9 | 1 | 3 | 1 | 10 | 22 | 4 | 0 | 0 | 3 | 25 |
| CONCORDIA | 606,250 | 621,522 | 120 | -5 | 18 | 22 | 3 | 1 | 1 | 1,970 | 339 | 2,004 | 10,166 | 10,418 | -252 | -2 | 7,664 | 40 | 120,784 | 76 | 7 | 9 | 27 | 48 | 3 | 9 | 1 | 39 | 38 | 92 | 8 | 85 | 9 | 2 | 3 | 1 | 1.3 | 3 | 5 | 4 | 3 | 88 | 4 | 0 | 0 | 11 | 76 |
| CRESTON-KENILWORTH | 507,500 | 489,919 | 84 | 2 | 12 | 47 | 26 | 0 | 0 | 1,627 | 325 | 1,563 | 8,974 | 9,083 | -108 | -1 | 11,183 | 35 | 86,804 | 44 | 15 | 7 | 21 | 37 | 4 | 9 | 0 | 51 | 38 | 87 | 13 | 73 | 14 | 3 | 10 | 0 | 0.8 | 5 | 12 | 7 | 5 | 65 | 6 | 0 | 0 | 6 | 81 |
| CRESTWOOD | 581,000 | 586,143 | 14 | 3 | 40 | 30 | 0 | 0 | 0 | 1,632 | 381 | 1,598 | 1,434 | 1,472 | -38 | -3 | 4,251 | 43 | 144,910 | 88 | 4 | 4 | 30 | 60 | 4 | 11 | 1 | 24 | 40 | 90 | 10 | 95 | 3 | 2 | 0 | 0 | 0.3 | 26 | 4 | 1 | 0 | 14 | 5 | 0 | 0 | 0 | 47 |
| CULLY | 447,750 | 455,523 | 140 | -7 | 19 | 46 | 23 | 1 | 2 | 1,451 | 337 | 1,418 | 13,239 | 12,937 | 301 | 2 | 4,219 | 37 | 66,766 | 56 | 20 | 10 | 30 | 28 | 3 | 16 | 2 | 50 | 23 | 77 | 23 | 81 | 9 | 7 | 3 | 0 | 3.1 | 3 | 5 | 4 | 4 | 63 | 4 | 0 | 0 | 13 | 58 |
| DOWNTOWN | 349,700 | 443,561 | 110 | -5 | -5 | 94 | 100 | 0 | 0 | 1,128 | 397 | 1,326 | 14,194 | 13,661 | 533 | 4 | 15,057 | 38 | 58,412 | 14 | 29 | 8 | 3 | 22 | 2 | 17 | 3 | 55 | 26 | 86 | 14 | 58 | 18 | 11 | 11 | 2 | 0.9 | 7 | 18 | 2 | 24 | 87 | 29 | 33 | 8 | 13 | 96 |
| DUNTHORPE | 1,905,000 | 2,399,250 | 26 | 5 | 37 | 70 | 0 | 0 | 0 | 5,291 | 466 | 1,974 | 2,066 | 2,046 | 20 | 1 | 1,751 | 33 | 158,270 | 91 | 3 | 4 | 34 | 48 | 2 | 5 | 0 | 44 | 43 | 89 | 11 | 85 | 4 | 3 | 7 | 0 | 1.2 | 0 | 3 | 1 | 10 | 13 | 1 | 0 | 0 | 2 | 11 |
| EAST COLUMBIA | 500,000 | 538,870 | 18 | 18 | 44 | 57 | 0 | 0 | 1 | 2,128 | 261 | 1,735 | 611 | 573 | 38 | 7 | 272 | 40 | 85,705 | 61 | 15 | 2 | 24 | 40 | 3 | 17 | 1 | 40 | 32 | 66 | 34 | 82 | 10 | 1 | 6 | 0 | 2.2 | 10 | 6 | 1 | 0 | 32 | 3 | 0 | 0 | 9 | 14 |
| EASTMORELAND | 899,500 | 969,434 | 62 | -2 | 19 | 36 | 2 | 0 | 0 | 2,803 | 349 | 2,187 | 6,692 | 6,872 | -180 | -3 | 6,025 | 41 | 163,843 | 77 | 6 | 5 | 31 | 51 | 3 | 11 | 1 | 33 | 36 | 91 | 9 | 82 | 11 | 3 | 3 | 0 | 1.1 | 2 | 4 | 3 | 4 | 25 | 5 | 1 | 1 | 6 | 53 |
| ELIOT | 513,000 | 575,498 | 44 | 0 | 1 | 34 | 23 | 0 | 1 | 1,855 | 330 | 1,605 | 5,600 | 5,332 | 267 | 5 | 6,625 | 36 | 62,872 | 17 | 21 | 5 | 11 | 19 | 5 | 15 | 1 | 59 | 33 | 88 | 12 | 67 | 22 | 3 | 7 | 1 | 0.8 | 1 | 13 | 5 | 7 | 43 | 8 | 1 | 3 | 10 | 89 |
| FAR SOUTHWEST | 639,500 | 676,231 | 22 | 14 | 39 | 27 | 5 | 0 | 0 | 2,206 | 324 | 1,938 | 2,065 | 2,102 | -37 | -2 | 3,470 | 53 | 99,152 | 72 | 6 | 3 | 19 | 53 | 4 | 15 | 1 | 28 | 35 | 87 | 13 | 88 | 3 | 6 | 2 | 0 | 0.6 | 3 | 3 | 1 | 3 | 19 | 4 | 0 | 0 | 2 | 38 |
| FOREST PARK* | 1,262,500 | 1,338,410 | 18 | 20 | 66 | 69 | 0 | 0 | 2 | 4,198 | 324 | 1,941 | 1,892 | 1,774 | 118 | 7 | 184 | 45 | 171,236 | 85 | 5 | 5 | 27 | 53 | 3 | 12 | 0 | 32 | 35 | 85 | 15 | 90 | 7 | 1 | 1 | 0 | 10.3 | 74 | 1 | 1 | 3 | 5 | 3 | 0 | 0 | 21 | 4 |
| FOSTER-POWELL | 465,000 | 471,794 | 99 | 2 | 16 | 29 | 14 | 0 | 2 | 1,543 | 333 | 1,691 | 8,065 | 8,542 | -477 | -6 | 9,064 | 41 | 93,339 | 60 | 10 | 6 | 22 | 41 | 4 | 12 | 1 | 41 | 30 | 81 | 19 | 89 | 7 | 1 | 2 | 1 | 0.9 | 1 | 7 | 5 | 1 | 68 | 6 | 0 | 0 | 6 | 86 |
| GLENFAIR | 434,200 | 423,540 | 20 | 6 | 29 | 43 | 0 | 0 | 0 | 1,648 | 270 | 1,331 | 2,719 | 2,533 | 186 | 7 | 8,568 | 38 | 58,252 | 43 | 19 | 1 | 25 | 33 | 9 | 12 | 2 | 44 | 16 | 63 | 37 | 89 | 6 | 2 | 3 | 0 | 0.3 | 2 | 10 | 0 | 2 | 13 | 3 | 1 | 1 | 4 | 61 |
| GOOSE HOLLOW | 340,000 | 391,996 | 53 | 3 | -1 | 77 | 87 | 0 | 0 | 1,156 | 358 | 1,547 | 5,860 | 5,915 | -55 | -1 | 17,280 | 38 | 81,039 | 29 | 16 | 5 | 9 | 28 | 2 | 11 | 1 | 58 | 36 | 85 | 15 | 70 | 14 | 5 | 9 | 2 | 0.3 | 1 | 16 | 2 | 15 | 35 | 15 | 3 | 2 | 3 | 94 |
| GRANT PARK | 840,000 | 940,904 | 42 | -10 | 20 | 24 | 0 | 0 | 0 | 2,727 | 340 | 2,233 | 3,746 | 3,978 | -232 | -6 | 8,209 | 44 | 137,748 | 78 | 7 | 5 | 28 | 56 | 3 | 10 | 0 | 31 | 43 | 88 | 12 | 86 | 10 | 2 | 2 | 0 | 0.5 | 7 | 3 | 6 | 3 | 21 | 3 | 0 | 0 | 4 | 84 |
| HAYDEN ISLAND | 344,000 | 351,618 | 63 | 4 | 36 | 102 | 38 | 0 | 1 | 1,460 | 234 | 2,583 | 2,372 | 2,522 | -150 | -6 | 1,716 | 55 | 64,306 | 80 | 11 | 5 | 9 | 45 | 8 | 22 | 0 | 26 | 21 | 87 | 13 | 91 | 3 | 2 | 3 | 0 | 1.4 | 0 | 1 | 0 | 2 | 3 | 1 | 0 | 0 | 2 | 36 |
| HAYHURST | 660,555 | 693,228 | 58 | 5 | 29 | 32 | 9 | 0 | 0 | 2,134 | 330 | 1,597 | 5,652 | 5,864 | -212 | -4 | 4,951 | 44 | 118,380 | 60 | 7 | 3 | 28 | 51 | 5 | 12 | 1 | 31 | 42 | 87 | 13 | 89 | 5 | 4 | 1 | 1 | 1.1 | 8 | 5 | 0 | 1 | 51 | 4 | 0 | 0 | 6 | 52 |
| HAZELWOOD | 415,000 | 408,876 | 199 | 4 | 30 | 40 | 17 | 1 | 1 | 1,582 | 279 | 1,411 | 24,617 | 24,655 | -38 | 0 | 6,017 | 38 | 60,212 | 48 | 19 | 6 | 27 | 36 | 5 | 15 | 2 | 42 | 21 | 71 | 29 | 85 | 10 | 2 | 2 | 1 | 4.1 | 2 | 11 | 1 | 3 | 122 | 13 | 4 | 3 | 34 | 64 |
| HEALY HEIGHTS | 925,000 | 925,000 | 1 | -26 | -46 | 0 | 0 | 0 | 0 | 2,194 | 422 | 1,487 | 193 | 192 | 1 | 1 | 3,277 | 39 | 129,338 | 51 | 7 | 2 | 29 | 53 | 4 | 13 | 1 | 29 | 36 | 86 | 14 | 83 | 9 | 2 | 4 | 1 | 0.1 | 3 | 5 | 1 | 14 | 3 | 1 | 0 | 0 | 1 | 13 |
| HILLSDALE | 682,475 | 762,163 | 106 | -3 | 19 | 41 | 8 | 0 | 0 | 2,377 | 327 | 1,535 | 7,764 | 7,964 | -200 | -3 | 4,146 | 43 | 130,759 | 67 | 7 | 2 | 25 | 54 | 3 | 11 | 1 | 31 | 42 | 90 | 10 | 86 | 7 | 2 | 4 | 1 | 1.9 | 6 | 6 | 1 | 5 | 100 | 12 | 0 | 0 | 13 | 57 |
| HILLSIDE | 920,630 | 1,038,892 | 68 | -12 | 15 | 66 | 43 | 0 | 0 | 2,697 | 410 | 1,831 | 1,303 | 1,325 | -22 | -2 | 1,882 | 48 | 199,721 | 82 | 4 | 5 | 26 | 68 | 2 | 5 | 0 | 25 | 38 | 84 | 16 | 85 | 10 | 3 | 2 | 1 | 0.7 | 29 | 1 | 1 | 8 | 29 | 4 | 0 | 0 | 3 | 47 |
| HOLLYWOOD | 625,000 | 642,078 | 18 | 2 | 29 | 24 | 17 | 0 | 0 | 2,313 | 288 | 1,592 | 2,324 | 2,397 | -73 | -3 | 9,816 | 44 | 98,996 | 48 | 9 | 5 | 22 | 44 | 2 | 17 | 0 | 37 | 46 | 86 | 14 | 86 | 7 | 1 | 5 | 1 | 0.2 | 0 | 10 | 2 | 3 | 24 | 6 | 1 | 3 | 3 | 94 |
| HOMESTEAD | 487,500 | 489,469 | 16 | -8 | -6 | 62 | 25 | 0 | 0 | 1,593 | 344 | 1,517 | 2,242 | 2,236 | 5 | 0 | 2,760 | 41 | 123,115 | 52 | 6 | 2 | 25 | 47 | 3 | 13 | 1 | 36 | 41 | 87 | 13 | 76 | 16 | 2 | 5 | 1 | 0.8 | 49 | 5 | 1 | 12 | 24 | 10 | 0 | 0 | 5 | 47 |
| HOSFORD-ABERNETHY | 650,000 | 656,104 | 79 | -2 | 5 | 32 | 35 | 0 | 0 | 2,076 | 342 | 1,716 | 8,376 | 8,220 | 155 | 2 | 6,440 | 39 | 105,724 | 43 | 12 | 8 | 15 | 37 | 2 | 10 | 1 | 50 | 36 | 92 | 8 | 81 | 11 | 3 | 5 | 0 | 1.3 | 0 | 7 | 9 | 5 | 56 | 9 | 5 | 3 | 13 | 92 |
| HUMBOLDT | 535,000 | 544,848 | 41 | -4 | 3 | 42 | 34 | 0 | 0 | 1,922 | 313 | 1,557 | 4,820 | 4,948 | -128 | -3 | 8,767 | 38 | 99,644 | 49 | 15 | 5 | 19 | 33 | 4 | 12 | 1 | 49 | 43 | 88 | 12 | 83 | 9 | 1 | 6 | 1 | 0.5 | 0 | 7 | 7 | 3 | 29 | 3 | 0 | 0 | 6 | 89 |
| IRVINGTON | 876,000 | 948,758 | 53 | -2 | 35 | 42 | 28 | 0 | 0 | 2,868 | 333 | 2,326 | 6,097 | 6,102 | -5 | 0 | 9,373 | 41 | 137,817 | 58 | 6 | 5 | 22 | 46 | 5 | 10 | 1 | 38 | 39 | 89 | 11 | 79 | 13 | 3 | 5 | 0 | 0.7 | 4 | 7 | 7 | 3 | 26 | 5 | 0 | 0 | 6 | 84 |
| KENTON | 460,000 | 467,958 | 131 | -4 | 15 | 43 | 18 | 0 | 1 | 1,527 | 331 | 1,724 | 7,970 | 7,860 | 111 | 1 | 2,321 | 40 | 92,302 | 63 | 13 | 2 | 25 | 40 | 3 | 16 | 1 | 40 | 32 | 73 | 27 | 83 | 10 | 2 | 5 | 0 | 3.4 | 6 | 7 | 1 | 1 | 52 | 6 | 3 | 1 | 17 | 73 |
| KERNS | 633,500 | 638,184 | 30 | 10 | 33 | 30 | 27 | 0 | 1 | 2,074 | 327 | 1,522 | 7,147 | 7,335 | -188 | -3 | 8,648 | 35 | 69,664 | 16 | 13 | 7 | 6 | 27 | 2 | 11 | 1 | 59 | 40 | 83 | 17 | 68 | 16 | 2 | 12 | 1 | 0.8 | 3 | 7 | 7 | 15 | 44 | 15 | 1 | 6 | 8 | 94 |
| KING | 566,500 | 569,256 | 68 | 3 | 3 | 30 | 15 | 0 | 2 | 1,980 | 310 | 1,845 | 7,047 | 7,219 | -172 | -2 | 11,370 | 35 | 104,987 | 49 | 11 | 6 | 23 | 33 | 2 | 11 | 1 | 52 | 36 | 86 | 14 | 77 | 13 | 3 | 6 | 1 | 0.6 | 1 | 12 | 7 | 2 | 34 | 3 | 0 | 0 | 5 | 89 |
| LAURELHURST | 900,000 | 946,741 | 76 | 0 | 24 | 28 | 0 | 0 | 0 | 3,018 | 318 | 1,410 | 4,911 | 4,976 | -65 | -1 | 7,354 | 46 | 178,890 | 83 | 3 | 3 | 36 | 60 | 2 | 9 | 0 | 29 | 36 | 93 | 7 | 89 | 5 | 2 | 5 | 0 | 0.7 | 8 | 2 | 5 | 7 | 38 | 6 | 0 | 3 | 4 | 82 |
| LENTS | 400,000 | 408,708 | 192 | 2 | 25 | 38 | 4 | 0 | 1 | 1,413 | 318 | 1,555 | 21,405 | 21,573 | -169 | -1 | 6,004 | 37 | 74,979 | 54 | 17 | 6 | 32 | 38 | 5 | 15 | 2 | 41 | 20 | 74 | 26 | 84 | 8 | 5 | 3 | 0 | 3.6 | 9 | 6 | 2 | 2 | 123 | 7 | 4 | 1 | 23 | 61 |
| LINNTON* | 475,000 | 540,153 | 15 | 27 | 9 | 99 | 20 | 0 | 0 | 2,371 | 240 | 1,468 | 149 | 135 | 14 | 10 | 104 | 43 | 114,699 | 82 | 7 | 4 | 21 | 38 | 2 | 17 | 0 | 42 | 30 | 92 | 8 | 91 | 8 | 1 | 0 | 0 | 1.4 | 7 | 1 | 2 | 3 | 34 | 2 | 0 | 0 | 8 | 4 |
| LLOYD DISTRICT | 275,000 | 275,000 | 1 | 34 | 23 | 161 | 0 | 0 | 0 | 1,359 | 202 | 1,668 | 2,917 | 2,766 | 151 | 5 | 5,697 | 39 | 52,400 | 12 | 25 | 7 | 6 | 18 | 7 | 17 | 1 | 58 | 33 | 86 | 14 | 67 | 21 | 4 | 8 | 1 | 0.5 | 1 | 16 | 6 | 9 | 51 | 13 | 17 | 6 | 9 | 91 |
| MADISON SOUTH | 433,750 | 443,078 | 100 | 2 | 20 | 42 | 16 | 0 | 2 | 1,610 | 291 | 1,512 | 8,277 | 8,393 | -117 | -1 | 4,712 | 41 | 91,205 | 60 | 12 | 5 | 28 | 33 | 4 | 18 | 1 | 44 | 24 | 86 | 14 | 91 | 7 | 0 | 1 | 0 | 1.8 | 11 | 9 | 3 | 6 | 47 | 8 | 1 | 3 | 8 | 57 |
| MAPLEWOOD | 552,500 | 622,269 | 31 | -17 | 3 | 39 | 23 | 0 | 1 | 2,003 | 321 | 1,916 | 2,684 | 2,798 | -114 | -4 | 4,335 | 45 | 115,372 | 79 | 2 | 4 | 21 | 54 | 5 | 14 | 0 | 26 | 45 | 88 | 12 | 89 | 5 | 3 | 2 | 1 | 0.6 | 3 | 2 | 1 | 1 | 20 | 1 | 0 | 0 | 5 | 34 |
| MARKHAM | 588,222 | 610,288 | 36 | -2 | 34 | 21 | 6 | 0 | 0 | 1,906 | 341 | 1,961 | 1,868 | 1,866 | 2 | 0 | 3,598 | 44 | 147,498 | 87 | 5 | 4 | 33 | 60 | 4 | 11 | 0 | 25 | 43 | 89 | 11 | 92 | 4 | 2 | 2 | 0 | 0.5 | 3 | 1 | 1 | 1 | 10 | 3 | 0 | 0 | 2 | 42 |
| MARSHALL PARK | 720,000 | 769,704 | 15 | 5 | 30 | 48 | 0 | 0 | 0 | 2,494 | 328 | 1,908 | 1,483 | 1,487 | -4 | 0 | 2,429 | 40 | 162,295 | 90 | 3 | 3 | 36 | 61 | 4 | 8 | 0 | 27 | 40 | 86 | 14 | 90 | 5 | 2 | 4 | 0 | 0.6 | 17 | 1 | 1 | 3 | 5 | 3 | 0 | 0 | 3 | 28 |
| MILL PARK | 399,000 | 387,264 | 41 | 1 | 29 | 33 | 22 | 0 | 0 | 1,334 | 303 | 1,419 | 8,813 | 8,840 | -26 | 0 | 8,712 | 40 | 63,095 | 48 | 26 | 6 | 29 | 36 | 5 | 15 | 3 | 41 | 15 | 63 | 37 | 86 | 5 | 3 | 2 | 3 | 1.0 | 3 | 12 | 1 | 2 | 30 | 4 | 0 | 0 | 9 | 70 |
| MONTAVILLA | 435,000 | 448,552 | 224 | -2 | 14 | 37 | 11 | 0 | 1 | 1,517 | 316 | 1,600 | 16,198 | 16,567 | -369 | -2 | 7,436 | 40 | 86,806 | 68 | 11 | 7 | 27 | 41 | 3 | 12 | 2 | 42 | 37 | 81 | 19 | 81 | 13 | 3 | 3 | 1 | 2.2 | 2 | 10 | 5 | 2 | 97 | 8 | 0 | 3 | 16 | 76 |
| MOUNT SCOTT-ARLETA | 446,500 | 450,300 | 107 | -1 | 18 | 29 | 7 | 0 | 0 | 1,452 | 340 | 1,700 | 7,666 | 7,840 | -174 | -2 | 8,875 | 38 | 97,909 | 67 | 9 | 4 | 24 | 37 | 4 | 13 | 2 | 45 | 34 | 87 | 13 | 85 | 8 | 3 | 3 | 1 | 0.9 | 2 | 8 | 3 | 1 | 46 | 5 | 0 | 0 | 7 | 80 |
| MOUNT TABOR | 735,000 | 794,366 | 131 | 7 | 31 | 25 | 4 | 0 | 1 | 2,537 | 330 | 1,502 | 11,440 | 11,506 | -66 | -1 | 7,158 | 43 | 109,522 | 66 | 6 | 5 | 24 | 48 | 4 | 10 | 1 | 38 | 38 | 87 | 13 | 84 | 10 | 1 | 4 | 0 | 1.6 | 17 | 6 | 6 | 3 | 75 | 5 | 0 | 0 | 12 | 69 |
| MULTNOMAH | 600,000 | 586,863 | 114 | 1 | 35 | 31 | 26 | 0 | 1 | 1,751 | 354 | 1,497 | 8,770 | 8,863 | -94 | -1 | 6,078 | 41 | 92,260 | 48 | 11 | 5 | 21 | 39 | 4 | 16 | 1 | 40 | 35 | 90 | 10 | 84 | 8 | 6 | 2 | 0 | 1.4 | 12 | 9 | 1 | 5 | 77 | 7 | 0 | 0 | 8 | 70 |
| NORTH TABOR | 448,750 | 504,855 | 56 | -23 | -7 | 42 | 16 | 0 | 1 | 1,642 | 334 | 1,396 | 5,374 | 5,279 | 95 | 2 | 9,183 | 41 | 87,910 | 42 | 14 | 5 | 16 | 39 | 4 | 14 | 2 | 41 | 31 | 89 | 11 | 82 | 12 | 1 | 5 | 0 | 0.6 | 1 | 7 | 3 | 3 | 37 | 6 | 0 | 3 | 4 | 77 |
| NORTHWEST DISTRICT | 458,000 | 572,271 | 120 | -8 | 4 | 56 | 68 | 0 | 2 | 1,521 | 405 | 1,671 | 16,561 | 16,637 | -77 | 0 | 11,376 | 36 | 89,984 | 27 | 11 | 5 | 9 | 27 | 1 | 16 | 1 | 55 | 39 | 86 | 13 | 66 | 15 | 8 | 8 | 3 | 1.5 | 2 | 6 | 8 | 13 | 79 | 8 | 7 | 1 | 15 | 93 |
| NORTHWEST HEIGHTS | 920,000 | 922,795 | 93 | 8 | 40 | 64 | 11 | 0 | 0 | 3,333 | 290 | 2,274 | 5,449 | 5,463 | -14 | 0 | 4,000 | 44 | 197,207 | 88 | 2 | 2 | 34 | 66 | 1 | 7 | 0 | 25 | 42 | 74 | 26 | 89 | 3 | 4 | 4 | 0 | 1.4 | 0 | 0 | 0 | 0 | 0 | 0 | 0 | 0 | 0 | 12 |
| OLD TOWN-CHINATOWN | 230,000 | 230,058 | 22 | -10 | -9 | 156 | 100 | 0 | 0 | 786 | 298 | 990 | 3,516 | 3,079 | 437 | 14 | 12,529 | 43 | 32,009 | 18 | 43 | 6 | 5 | 20 | 2 | 18 | 4 | 56 | 18 | 87 | 13 | 65 | 21 | 6 | 8 | 1 | 0.3 | 6 | 17 | 2 | 25 | 25 | 20 | 7 | 7 | 7 | 97 |
| OVERLOOK | 537,500 | 551,699 | 85 | 4 | 14 | 32 | 12 | 0 | 0 | 1,931 | 307 | 1,725 | 7,837 | 7,722 | 115 | 1 | 7,712 | 36 | 104,695 | 52 | 9 | 6 | 19 | 30 | 3 | 13 | 1 | 50 | 43 | 89 | 9 | 82 | 9 | 2 | 4 | 1 | 1.0 | 4 | 6 | 7 | 3 | 69 | 6 | 3 | 1 | 15 | 74 |
| PARKROSE | 400,000 | 397,728 | 47 | -2 | 23 | 41 | 4 | 0 | 0 | 1,535 | 286 | 1,362 | 5,411 | 5,387 | 24 | 0 | 2,693 | 39 | 58,520 | 54 | 22 | 9 | 29 | 27 | 4 | 15 | 4 | 51 | 14 | 75 | 25 | 75 | 10 | 9 | 5 | 1 | 2.0 | 0 | 9 | 1 | 5 | 69 | 7 | 1 | 1 | 12 | 56 |
| PARKROSE HEIGHTS | 413,750 | 422,911 | 64 | -4 | 21 | 39 | 3 | 0 | 0 | 1,422 | 321 | 1,471 | 6,021 | 5,924 | 97 | 2 | 6,184 | 43 | 79,346 | 69 | 5 | 6 | 35 | 41 | 5 | 18 | 4 | 32 | 24 | 64 | 36 | 89 | 8 | 1 | 1 | 0 | 1.0 | 2 | 9 | 1 | 3 | 36 | 8 | 0 | 0 | 8 | 60 |
| PEARL | 448,000 | 553,879 | 163 | -6 | -15 | 90 | 98 | 1 | 0 | 1,196 | 448 | 1,881 | 10,192 | 9,852 | 340 | 3 | 22,882 | 39 | 122,292 | 27 | 11 | 2 | 4 | 33 | 1 | 11 | 2 | 53 | 38 | 86 | 14 | 71 | 15 | 2 | 13 | 0 | 0.4 | 3 | 7 | 0 | 11 | 16 | 9 | 12 | 3 | 6 | 98 |
| PIEDMONT | 540,000 | 555,179 | 81 | -5 | 25 | 38 | 4 | 0 | 3 | 2,030 | 291 | 1,646 | 7,230 | 7,380 | -150 | -2 | 7,503 | 39 | 96,085 | 54 | 14 | 8 | 19 | 37 | 7 | 12 | 1 | 42 | 36 | 86 | 14 | 84 | 9 | 2 | 5 | 0 | 1.0 | 6 | 8 | 3 | 2 | 45 | 5 | 0 | 0 | 8 | 73 |
| PLEASANT VALLEY* | 570,000 | 554,602 | 104 | -2 | 35 | 46 | 4 | 0 | 2 | 2,347 | 251 | 1,827 | 12,775 | 12,522 | 253 | 2 | 2,886 | 40 | 91,830 | 78 | 12 | 3 | 40 | 57 | 5 | 7 | 2 | 30 | 19 | 64 | 36 | 87 | 8 | 4 | 1 | 0 | 4.4 | 37 | 3 | 0 | 2 | 22 | 4 | 0 | 0 | 10 | 22 |
| PORTSMOUTH | 440,500 | 444,362 | 108 | -4 | 17 | 42 | 7 | 0 | 1 | 1,369 | 349 | 1,395 | 9,970 | 10,224 | -254 | -2 | 9,166 | 34 | 85,872 | 55 | 27 | 7 | 25 | 35 | 2 | 13 | 0 | 49 | 26 | 80 | 20 | 87 | 9 | 1 | 3 | 0 | 1.1 | 9 | 8 | 3 | 1 | 53 | 4 | 0 | 0 | 10 | 62 |
| POWELLHURST-GILBERT | 370,000 | 371,924 | 188 | 0 | 22 | 43 | 22 | 0 | 5 | 1,420 | 270 | 1,491 | 24,706 | 25,087 | -381 | -2 | 7,194 | 38 | 68,271 | 56 | 18 | 6 | 36 | 40 | 4 | 13 | 2 | 40 | 15 | 64 | 36 | 87 | 7 | 2 | 2 | 1 | 3.4 | 6 | 7 | 1 | 2 | 121 | 6 | 1 | 1 | 25 | 54 |
| REED | 600,000 | 634,971 | 37 | 8 | 5 | 28 | 5 | 0 | 0 | 1,939 | 349 | 1,602 | 2,840 | 2,980 | -140 | -5 | 6,154 | 33 | 81,318 | 47 | 12 | 7 | 21 | 33 | 3 | 16 | 1 | 48 | 32 | 91 | 9 | 77 | 13 | 4 | 5 | 1 | 0.5 | 0 | 11 | 3 | 10 | 35 | 3 | 0 | 0 | 2 | 61 |
| RICHMOND | 610,000 | 636,514 | 145 | -4 | 15 | 27 | 16 | 0 | 0 | 2,012 | 341 | 1,774 | 12,789 | 13,071 | -282 | -2 | 10,057 | 39 | 116,432 | 56 | 8 | 4 | 22 | 42 | 2 | 11 | 1 | 44 | 38 | 91 | 9 | 85 | 10 | 1 | 4 | 1 | 1.3 | 1 | 6 | 11 | 4 | 71 | 5 | 0 | 0 | 7 | 91 |
| ROSE CITY PARK | 600,000 | 628,320 | 113 | -8 | 18 | 27 | 6 | 0 | 0 | 2,105 | 315 | 1,545 | 10,333 | 10,435 | -101 | -1 | 8,633 | 44 | 121,271 | 74 | 7 | 4 | 28 | 49 | 3 | 13 | 1 | 34 | 41 | 88 | 12 | 90 | 7 | 2 | 2 | 0 | 1.2 | 3 | 7 | 4 | 3 | 53 | 6 | 1 | 3 | 8 | 78 |
| ROSEWAY | 544,538 | 525,408 | 88 | 7 | 28 | 24 | 0 | 0 | 0 | 1,845 | 300 | 1,864 | 5,798 | 6,026 | -229 | -4 | 6,887 | 41 | 104,373 | 71 | 5 | 5 | 20 | 41 | 3 | 18 | 1 | 38 | 37 | 90 | 10 | 90 | 8 | 0 | 1 | 0 | 0.8 | 1 | 6 | 3 | 3 | 49 | 4 | 0 | 0 | 7 | 78 |
| RUSSELL | 480,000 | 474,407 | 42 | 7 | 31 | 38 | 0 | 0 | 1 | 1,816 | 278 | 1,839 | 3,777 | 3,615 | 163 | 5 | 4,730 | 51 | 76,562 | 86 | 11 | 2 | 20 | 48 | 12 | 13 | 1 | 27 | 24 | 79 | 21 | 90 | 6 | 3 | 0 | 0 | 0.8 | 3 | 4 | 0 | 1 | 34 | 3 | 0 | 0 | 6 | 38 |
| SABIN | 805,000 | 810,290 | 61 | 3 | 28 | 16 | 0 | 0 | 0 | 2,416 | 347 | 2,223 | 5,300 | 5,350 | -50 | -1 | 11,263 | 38 | 141,263 | 66 | 8 | 6 | 27 | 41 | 3 | 11 | 1 | 43 | 35 | 87 | 13 | 81 | 9 | 2 | 7 | 0 | 0.5 | 1 | 8 | 10 | 3 | 18 | 2 | 0 | 0 | 4 | 83 |
| SELLWOOD-MORELAND | 650,000 | 676,321 | 149 | 2 | 28 | 45 | 27 | 0 | 0 | 1,985 | 353 | 1,667 | 10,992 | 10,652 | 340 | 3 | 5,284 | 40 | 85,099 | 52 | 10 | 7 | 24 | 43 | 3 | 12 | 1 | 41 | 38 | 91 | 9 | 83 | 7 | 2 | 8 | 0 | 2.1 | 23 | 5 | 7 | 6 | 38 | 5 | 0 | 0 | 16 | 81 |
| SOUTH BURLINGAME | 617,500 | 605,176 | 38 | 6 | 24 | 41 | 16 | 0 | 0 | 2,093 | 316 | 2,049 | 1,955 | 1,949 | 6 | 0 | 4,600 | 44 | 128,274 | 83 | 8 | 6 | 28 | 52 | 3 | 14 | 0 | 31 | 49 | 94 | 6 | 92 | 4 | 3 | 1 | 0 | 0.4 | 5 | 2 | 1 | 2 | 25 | 8 | 0 | 0 | 3 | 63 |
| SOUTH PORTLAND | 525,000 | 565,876 | 145 | 13 | 14 | 73 | 60 | 0 | 2 | 1,591 | 370 | 1,782 | 10,704 | 11,083 | -379 | -3 | 6,287 | 37 | 101,481 | 42 | 12 | 4 | 13 | 35 | 4 | 15 | 1 | 45 | 39 | 88 | 12 | 70 | 18 | 5 | 6 | 0 | 1.7 | 6 | 7 | 3 | 11 | 43 | 18 | 8 | 4 | 15 | 72 |
| SOUTH TABOR | 510,000 | 508,092 | 89 | -7 | 13 | 40 | 17 | 0 | 0 | 1,574 | 345 | 1,670 | 6,842 | 6,847 | -5 | 0 | 8,562 | 41 | 103,361 | 63 | 4 | 5 | 27 | 44 | 0 | 12 | 1 | 43 | 31 | 82 | 18 | 86 | 9 | 3 | 1 | 1 | 0.8 | 2 | 5 | 4 | 2 | 35 | 4 | 0 | 0 | 5 | 76 |
| SOUTHWEST HILLS* | 1,000,000 | 1,145,105 | 94 | 3 | 28 | 61 | 10 | 0 | 0 | 3,423 | 345 | 1,836 | 6,766 | 6,836 | -71 | -1 | 3,504 | 42 | 161,556 | 64 | 7 | 3 | 29 | 58 | 3 | 9 | 1 | 29 | 38 | 88 | 12 | 83 | 8 | 3 | 5 | 1 | 1.9 | 14 | 4 | 1 | 9 | 53 | 6 | 0 | 2 | 12 | 32 |
| ST. JOHNS | 444,450 | 446,010 | 218 | 4 | 22 | 46 | 17 | 1 | 0 | 1,455 | 329 | 1,695 | 13,970 | 13,575 | 395 | 3 | 1,271 | 38 | 81,557 | 60 | 15 | 3 | 26 | 39 | 3 | 15 | 1 | 41 | 29 | 70 | 30 | 83 | 10 | 1 | 5 | 0 | 11.0 | 31 | 7 | 1 | 1 | 92 | 6 | 0 | 0 | 24 | 63 |
| SULLIVAN’S GULCH | 299,500 | 420,427 | 37 | -10 | -17 | 62 | 70 | 0 | 0 | 1,542 | 324 | 1,653 | 3,099 | 3,232 | -133 | -4 | 9,716 | 37 | 82,202 | 32 | 11 | 7 | 10 | 32 | 3 | 14 | 0 | 51 | 42 | 90 | 10 | 67 | 23 | 5 | 4 | 1 | 0.3 | 2 | 7 | 10 | 4 | 33 | 6 | 1 | 3 | 4 | 81 |
| SUMNER | 412,500 | 394,192 | 24 | -1 | 35 | 31 | 0 | 0 | 0 | 1,509 | 277 | 1,461 | 1,994 | 2,034 | -40 | -2 | 2,554 | 39 | 64,329 | 65 | 21 | 9 | 26 | 21 | 4 | 15 | 3 | 57 | 19 | 74 | 26 | 72 | 15 | 8 | 4 | 1 | 0.8 | 3 | 7 | 2 | 5 | 24 | 5 | 0 | 1 | 3 | 65 |
| SUNDERLAND | 386,000 | 386,000 | 1 | – | – | 0 | 0 | 0 | 0 | 1,104 | 350 | 1,506 | 318 | 301 | 17 | 6 | 171 | 37 | 60,641 | 56 | 25 | 9 | 32 | 22 | 4 | 17 | 3 | 53 | 13 | 71 | 29 | 69 | 14 | 12 | 5 | 1 | 1.9 | 5 | 8 | 0 | 6 | 32 | 4 | 0 | 0 | 5 | 12 |
| SUNNYSIDE | 545,000 | 580,429 | 66 | -13 | 4 | 38 | 29 | 0 | 0 | 1,899 | 333 | 1,746 | 7,928 | 7,927 | 1 | 0 | 13,270 | 38 | 98,923 | 43 | 12 | 6 | 14 | 32 | 3 | 14 | 1 | 50 | 44 | 92 | 8 | 77 | 13 | 4 | 6 | 0 | 0.6 | 0 | 8 | 9 | 4 | 35 | 3 | 0 | 0 | 5 | 93 |
| SYLVAN-HIGHLANDS | 837,000 | 908,587 | 20 | -1 | 10 | 41 | 15 | 0 | 0 | 2,830 | 320 | 2,267 | 1,393 | 1,277 | 116 | 9 | 1,840 | 45 | 208,418 | 83 | 7 | 2 | 33 | 70 | 1 | 7 | 0 | 22 | 42 | 90 | 10 | 81 | 6 | 8 | 5 | 0 | 0.8 | 15 | 1 | 2 | 3 | 9 | 4 | 0 | 2 | 5 | 19 |
| UNIVERSITY PARK | 520,000 | 510,910 | 75 | -9 | 14 | 40 | 20 | 0 | 0 | 1,786 | 305 | 1,969 | 6,862 | 7,051 | -189 | -3 | 5,356 | 23 | 108,573 | 71 | 17 | 5 | 20 | 29 | 2 | 5 | 2 | 59 | 29 | 87 | 10 | 75 | 9 | 4 | 7 | 2 | 1.3 | 3 | 3 | 5 | 16 | 44 | 3 | 0 | 0 | 6 | 54 |
| VERNON | 630,500 | 630,440 | 40 | 14 | 24 | 28 | 10 | 0 | 0 | 2,040 | 328 | 1,897 | 2,709 | 2,786 | -77 | -3 | 8,740 | 38 | 126,624 | 64 | 8 | 5 | 25 | 42 | 2 | 11 | 1 | 43 | 39 | 91 | 9 | 84 | 8 | 2 | 5 | 1 | 0.3 | 8 | 7 | 8 | 4 | 15 | 2 | 0 | 0 | 1 | 90 |
| WEST PORTLAND PARK | 561,500 | 547,851 | 52 | 9 | 27 | 41 | 19 | 0 | 0 | 1,702 | 333 | 1,586 | 4,231 | 4,272 | -41 | -1 | 5,800 | 37 | 93,464 | 55 | 8 | 0 | 29 | 47 | 4 | 8 | 2 | 40 | 35 | 81 | 19 | 91 | 3 | 5 | 1 | 0 | 0.7 | 8 | 8 | 1 | 2 | 28 | 5 | 0 | 0 | 3 | 57 |
| WILKES | 460,000 | 435,423 | 151 | 0 | 36 | 39 | 23 | 1 | 4 | 1,693 | 271 | 1,518 | 9,052 | 8,735 | 316 | 4 | 2,937 | 44 | 85,467 | 69 | 14 | 5 | 29 | 42 | 7 | 12 | 1 | 38 | 19 | 66 | 34 | 91 | 6 | 2 | 1 | 0 | 3.1 | 10 | 3 | 0 | 2 | 60 | 6 | 0 | 0 | 18 | 30 |
| WOODLAND PARK | 455,000 | 461,960 | 5 | 12 | 38 | 29 | 0 | 0 | 0 | 1,691 | 273 | 1,747 | 297 | 283 | 14 | 5 | 6,190 | 39 | 76,875 | 67 | 5 | 6 | 40 | 33 | 6 | 23 | 3 | 35 | 27 | 64 | 36 | 85 | 11 | 1 | 1 | 1 | 0.0 | 0 | 14 | 1 | 2 | 3 | 7 | 0 | 1 | 1 | 69 |
| WOODLAWN | 452,500 | 489,878 | 86 | -11 | -3 | 44 | 19 | 1 | 0 | 1,508 | 342 | 1,746 | 5,290 | 5,331 | -41 | -1 | 7,225 | 39 | 110,456 | 65 | 7 | 4 | 23 | 47 | 2 | 10 | 1 | 40 | 39 | 90 | 10 | 88 | 6 | 2 | 4 | 1 | 0.7 | 2 | 8 | 6 | 3 | 34 | 4 | 0 | 0 | 6 | 74 |
| WOODSTOCK | 539,900 | 571,962 | 145 | 4 | 22 | 46 | 3 | 0 | 0 | 1,807 | 347 | 2,162 | 8,816 | 8,869 | -53 | -1 | 7,072 | 40 | 129,043 | 76 | 8 | 6 | 30 | 52 | 3 | 9 | 1 | 35 | 37 | 92 | 8 | 82 | 9 | 5 | 4 | 0 | 1.2 | 2 | 6 | 5 | 4 | 85 | 5 | 0 | 0 | 8 | 74 |
| X-PORTLAND TOTAL | 500,000 | 567,162 | 6,999 | 0 | 18 | 43 | 20 | 9 | 52 | 1,840 | 326 | 1,596 | 642,715 | 646,101 | -3,386 | -1 | 4,430 | 39 | 88,792 | 53 | 13 | 6 | 22 | 40 | 4 | 13 | 1 | 43 | 32 | 82 | 18 | 82 | 10 | 3 | 4 | 1 | 145 | 14 | 5 | 7 | 4 | 4,346 | 51 | 134 | 8 | 481 | 67 |
Methodology
Neighborhood Boundaries represent records maintained by the city as of January 2025. Boundary conflicts were resolved for statistical purposes only. Due to overlap between certain neighborhoods, boundary definitions may vary occasionally across categories. With the exception of the area unofficially (but universally) known as Dunthorpe, unclaimed sections of Multnomah County were excluded. *Neighborhood boundary extends beyond city limits; only data within city limits calculated.
Real Estate 2024 data from the Regional Multiple Listing Service with analysis by the Center for Spatial Analysis and Research at Portland State University’s Department of Geography. Figures were rounded for legibility. In neighborhoods with very few home sales, such as Woodland Park, Healy Heights, and Sauvie Island, the year-to-year change can appear exaggerated.
People Data for all “people” columns, rent costs, and commuting from the US Census Bureau’s American Community Survey 5-Year Estimates 2019–2023, released in late 2024. The ACS data are estimates only, and accuracy varies by attribute.
Rent Costs Calculated from all renter-occupied units, estimated median rent is not adjusted for unit size or number of occupants. Figure includes estimated monthly utility costs.
Median Income The Census defines household as including “all the persons who occupy a housing unit as their usual place of residence.” Thus living situations in this estimate range from individuals to large households.
Parks Data from Metro and/or individual cities.
Transit Information from TriMet.
Walk Score Data from WalkScore.com, now a part of real estate agency Redfin. This score reflects, on a scale of 1 to 100, a neighborhood’s pedestrian-friendliness based on distances to amenities such as grocery stores and other routine destinations. For some cities and neighborhoods with a commercial central point or a large nonresidential area (such as Forest Park), the score was taken from a point in a central residential portion.
Unavailable Data is noted with a dash (—).
Real estate and other analysis by Owen Scholes and David Banis of PSU’s Center for Spatial Analysis and Research.
Share this content:
Author: Hey PDX
Hey PDX Team


Post Comment