Oregon Ducks Softball: Postseason Statistical Comparison
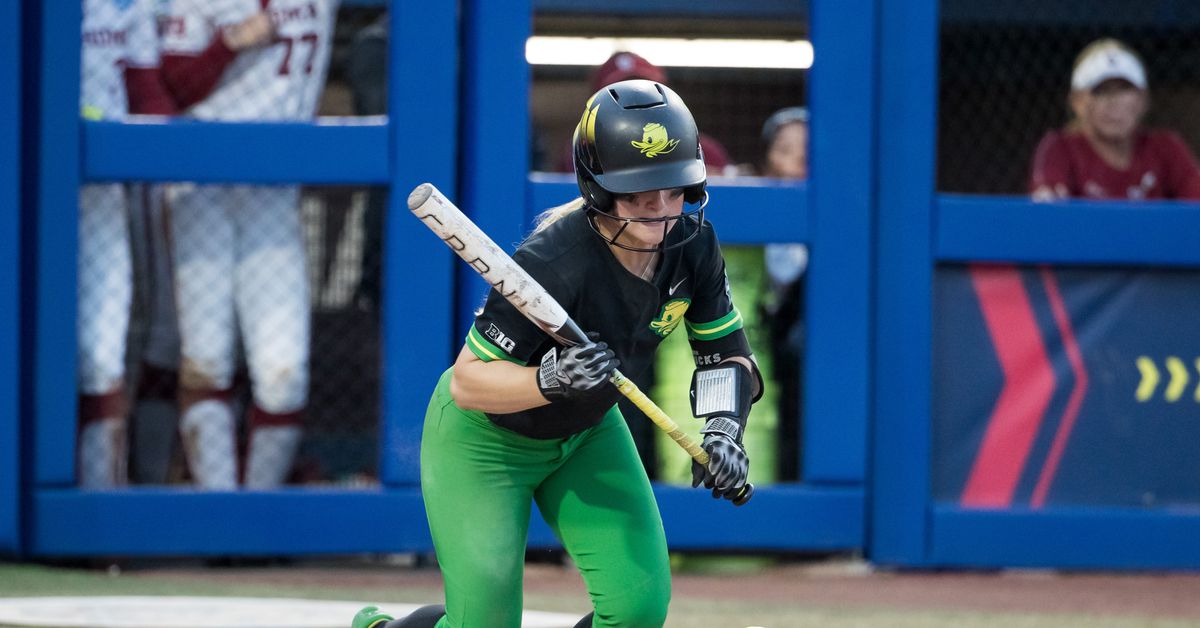
I wanted to follow up the study I did last off season where I compiled a data set of recent Women’s College World Series teams and how Oregon softball squads have compared. By definition, in this past season the Ducks were a WCWS quality team in 2025. They did only manage to win one game in OKC though, so what do the numbers say about where they need to improve to go deeper in the tournament?
I collected pitching and hitting data from Softball Statline and D1Softball for the teams who made the Women’s College World Series in 2021, 2022, 2023, 2024, and 2025. I will go over the batting data first. Let’s review the statistics I compiled.
HR/AB – Home Runs per At Bat is right as it says “on the tin,” the total number of home runs a player hit divided by their number of at bats.
AVG – Batting average is the number of base hits (regardless of how many bases the batter took) divided by the number of at bats.
OBP – On Base Percentage adds the number of times a batter got on base (including walks and being hit by a pitch) and divides by the number of at bats.
OPS – Short of On Base Plus Slugging combines a batter’s efficiency and power into a single measurement. Slugging average is computed as the total number of bases a batter attains off of their hits (so singles count 1, doubles, 2, etc.) divided by the number of at bats. OPS is then the sum of OBP and slugging average.
I computed weighted averages in these statistics for each team. The chart below shows the central tendency and spread for each.
WCWS Batting: 2021-2025
| Statistic | AVG | HR/AB | OBP | SLG | OPS |
|---|---|---|---|---|---|
| Statistic | AVG | HR/AB | OBP | SLG | OPS |
| Median | 0.330 | 0.053 | 0.408 | 0.557 | 0.972 |
| Std Dev | 0.034 | 0.021 | 0.037 | 0.092 | 0.126 |
Tristan Holmes, softballstatline.com , and d1softball.com
Let’s see how the Ducks compared to this standard over the years.
Oregon Softball Batting: 2021-2025
| Season | AVG | HR/AB | OBP | SLG | OPS |
|---|---|---|---|---|---|
| Season | AVG | HR/AB | OBP | SLG | OPS |
| 2021 | 0.312 | 0.040 | 0.375 | 0.501 | 0.876 |
| 2022 | 0.306 | 0.055 | 0.361 | 0.532 | 0.893 |
| 2023 | 0.306 | 0.050 | 0.373 | 0.517 | 0.890 |
| 2024 | 0.319 | 0.041 | 0.377 | 0.507 | 0.884 |
| 2025 | 0.353 | 0.053 | 0.441 | 0.592 | 1.034 |
Tristan Holmes, softballstatline.com, and d1softball.com
Oregon has had WCWS quality offense for most of the Lombardi era, and all measures improved noticeably in 2025. Obviously, this has to be taken with a grain of salt as the Ducks moved to a much weaker softball conference than the old Pac-12. Given that the numbers did not stay static, and the success of the 2025 season, it seems most reasonable to me to assume the overall batting quality has remained steady with possibly slightly more power than previous teams.
:format(webp):no_upscale()/cdn.vox-cdn.com/uploads/chorus_asset/file/26024252/usa_today_26351749.jpg)
Brett Rojo-Imagn Images
What about the defense? Here is a glossary of the statistics I compiled for pitching.
ERA – Earned Run Average estimates how many runs a pitcher will surrender in the course of a given game. It is computed by taking the total earned runs a pitcher gives up, dividing by innings pitches, then multiplying by 7.
BB7 – An estimate of how many walks a pitching staff gives up in a typical game (known as BB9 for baseball). This is found by taking the number of home runs a pitcher gives up, dividing by the number of innings pitched, and then multiplying the result by 7 for softball.
SO7 – Same as BB7, but this time estimating the number of strike outs a pitching staff gets per game.
WHIP – Walks Plus Hits per Inning Pitched adds the total number of base hits and walks a pitcher gives up, then divides by the number of innings pitched. The result estimates how many players a pitcher will allow on base in a typical inning.
FIP – Field Independent Pitching is meant to estimate a pitcher’s ERA if they experienced league average fielding throughout their time in the circle. The formula is a bit involved and has to be adjusted by a constant based on the observed data for a particular league (in this case NCAA DIV-1 Softball).
WCWS Pitching: 2021-2025
| Statistic | ERA | BB7 | SO7 | WHIP | FIP |
|---|---|---|---|---|---|
| Statistic | ERA | BB7 | SO7 | WHIP | FIP |
| Median | 1.947 | 2.170 | 7.394 | 1.117 | 2.530 |
| Std Dev | 0.619 | 0.527 | 1.497 | 0.171 | 0.846 |
Tristan Holmes, softballstatline.com , and d1softball.com
The numbers below how the Ducks’ bull pen has compared to this standard over the years.
Oregon Softball Pitching: 2021-2025
| Season | ERA | BB7 | SO7 | WHIP | FIP |
|---|---|---|---|---|---|
| Season | ERA | BB7 | SO7 | WHIP | FIP |
| 2021 | 2.682 | 2.182 | 10.136 | 1.175 | 2.325 |
| 2022 | 3.753 | 2.485 | 7.260 | 1.427 | 4.183 |
| 2023 | 2.863 | 1.585 | 4.997 | 1.303 | 3.353 |
| 2024 | 3.300 | 2.207 | 4.675 | 1.466 | 4.106 |
| 2025 | 2.125 | 2.327 | 7.592 | 1.070 | 2.695 |
Tristan Holmes, softballstatline.com , and d1softball.com
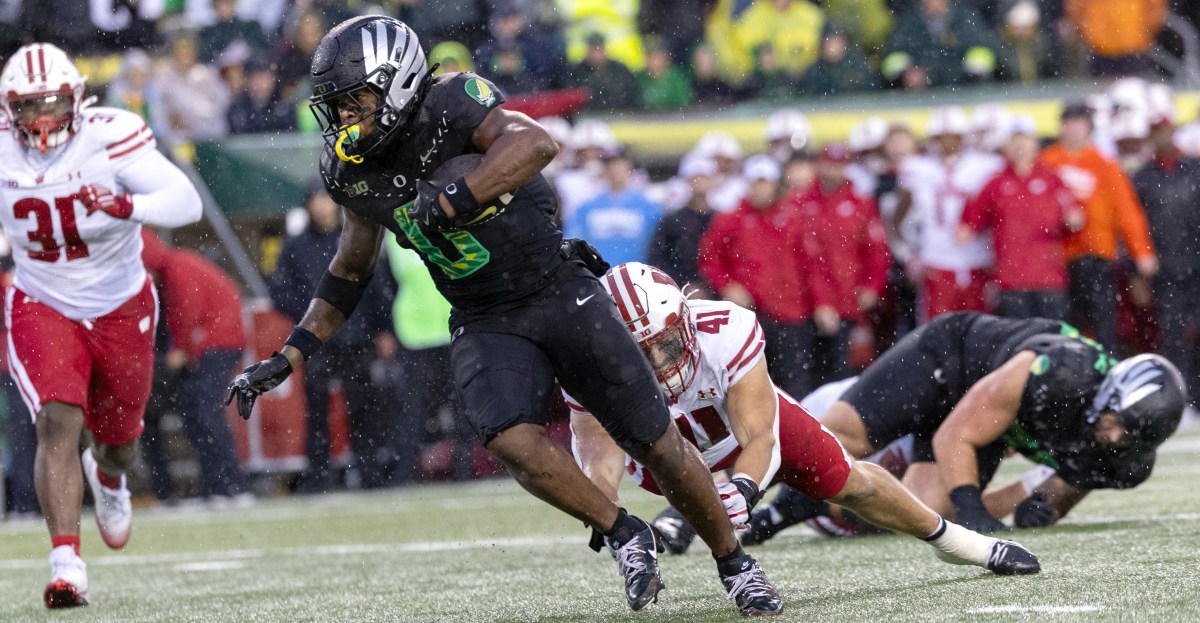
The pitching would seem to have taken a major leap to WCWS quality in 2025… but again we have to take into account that much of this comes against Big Ten competition. A future project this summer might be for me to break down the team’s performance against stronger non-conference opponents compared to Big Ten competition. Another idea is to look at individual members of the pitching rotation and compare them to their starter/reliever counterparts on other WCWS teams. Let me know what you’d like to see investigated in the comments.
:format(webp):no_upscale()/cdn.vox-cdn.com/uploads/chorus_asset/file/26015641/usa_today_26352017.jpg)
SARAH PHIPPS/THE OKLAHOMAN / USA TODAY NETWORK via Imagn Images
Share this content:
Author: Hey PDX
Hey PDX Team


Post Comment