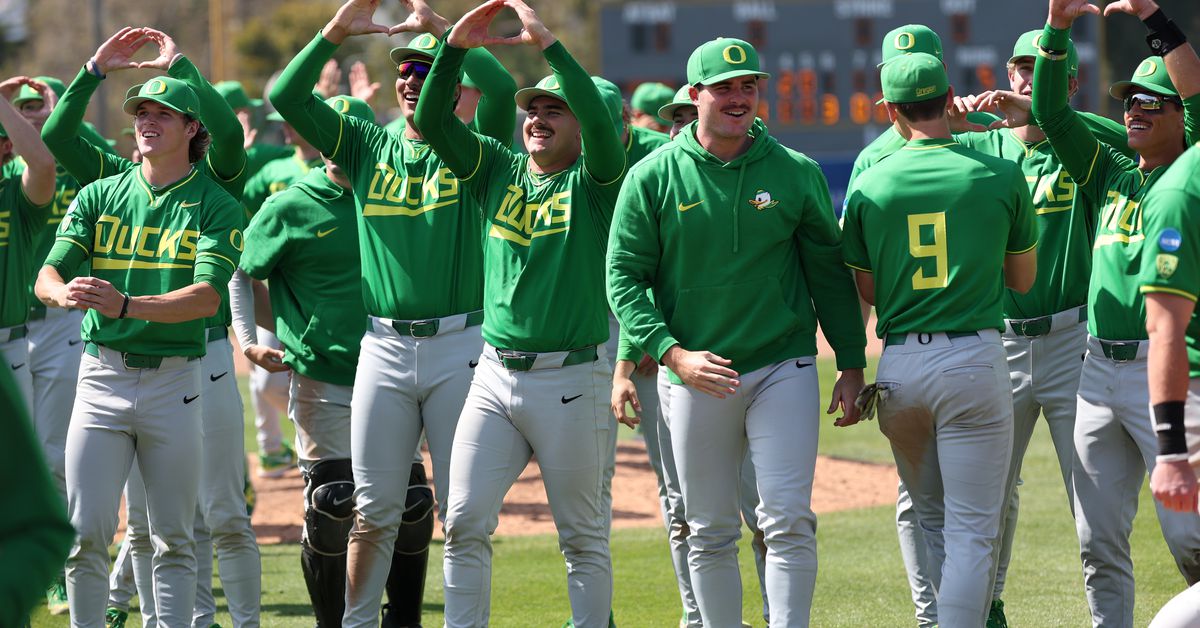
Oregon Ducks Baseball: Big Ten Advanced Stats Preview
Similar to the short preview I did for the softball team, today I will be looking at advanced team stats for the current Big Ten conference ahead of Duck Baseball’s season opening series against Toledo this Friday. Below I have compiled results from D1Baseball.com for all 17 baseball programs in the Big Ten (Wisconsin does not sponsor baseball as a varsity sports). First, a primer on the information I’ve included in this article.
- DSR Rank – The rank of the team’s DSR score among all Division 1 teams
- DSR – The raw DSR number for the team in 2024, an advanced statistic meant to measure the probability of beating an average team.
- WPCT – Winning percentage of the team’s actual record.
- Pythag – The Pythagorean Winning Percentage for the team. This statistic is computed solely from runs scored and runs allowed, and bears a striking resemblance to computing the sine or cosine of an angle using the Pythagorean Theorem. The result is meant to measure how many games a team with this performance would typically win. Teams that overperform their Pythagorean Percentage are considered to have benefited from extraneous circumstances and vice versa.
- SOS – Strength of schedule computed as the aggregate winning percentage of all opponents at the time the matchup occurred.
Untitled
| Team | DSR Rank |
DSR | W-L-T | WPCT | SOS | Pythag |
|---|---|---|---|---|---|---|
| Team | DSR Rank |
DSR | W-L-T | WPCT | SOS | Pythag |
| Oregon | 32 | 0.609 | 40-20-0 | 0.667 | 0.496 | 0.639 |
| Nebraska | 42 | 0.592 | 40-22-0 | 0.645 | 0.619 | 0.635 |
| Illinois | 50 | 0.579 | 35-21-0 | 0.625 | 0.561 | 0.611 |
| USC | 53 | 0.577 | 31-28-0 | 0.525 | 0.6 | 0.522 |
| Indiana | 55 | 0.576 | 33-26-1 | 0.558 | 0.566 | 0.587 |
| Maryland | 81 | 0.543 | 34-22-0 | 0.607 | 0.501 | 0.516 |
| Iowa | 85 | 0.542 | 29-23-0 | 0.566 | 0.526 | 0.639 |
| Michigan | 92 | 0.538 | 32-28-0 | 0.533 | 0.556 | 0.469 |
| Purdue | 94 | 0.533 | 32-24-0 | 0.579 | 0.512 | 0.679 |
| Rutgers | 97 | 0.528 | 28-25-0 | 0.528 | 0.515 | 0.582 |
| Ohio State | 99 | 0.527 | 29-26-0 | 0.527 | 0.564 | 0.536 |
| Michigan State | 109 | 0.512 | 24-27-0 | 0.471 | 0.55 | 0.468 |
| Washington | 120 | 0.502 | 19-31-1 | 0.382 | 0.59 | 0.438 |
| Penn State | 123 | 0.499 | 29-24-0 | 0.547 | 0.47 | 0.53 |
| Minnesota | 147 | 0.486 | 24-23-0 | 0.521 | 0.473 | 0.585 |
| UCLA | 154 | 0.482 | 19-33-0 | 0.365 | 0.581 | 0.391 |
| Northwestern | 215 | 0.429 | 18-34-0 | 0.346 | 0.576 | 0.361 |
What to make of all of this? Despite 2024 being something of a down season for Pac-12 baseball, the conference was well ahead of the Big Ten.. The only Pac-12 team ahead of the Ducks in 2024 in DSR was the Beavers at 16, but Arizona, Cal, and Arizona State were all in the top 50. This means the Big Ten’s best, Nebraska, was well below the top two teams in the Pac-12. Further, only Nebraska, Illinois, and Indiana were rated comparably to the Pac-12’s second tier squads.
Individual teams are bound to significantly improve or fall off compared to last season. That said, if the general power level of the ‘old’ Big Ten schools remains as it was, the Ducks should be the best team in the conference and significantly better than 2⁄3 of the schools in their new league. There is no reason to believe the 2025 squad cannot improve on their record from 2024. The biggest test of the season looks to be the non-conference series against Oregon State in the Spring. How Oregon holds up compared to the northwest’s best baseball program (historically) will tell us a lot about whether it is reasonable to hope the Ducks can win a super-regional.
Share this content:


Post Comment