Baseball: Pitching Statistical Review – Addicted To Quack
After completing my second breakdown of Oregon baseball’s statistical performance compared to five years of College World Series teams it was obvious that to make it to Omaha the Ducks have to improve their pitching. I decided to do a follow up and take a more granular look at the pitching staff. I also took the opportunity to access more statistics than I had used in previous articles, so all the numbers you see in this article come courtesy of d1baseball.com.
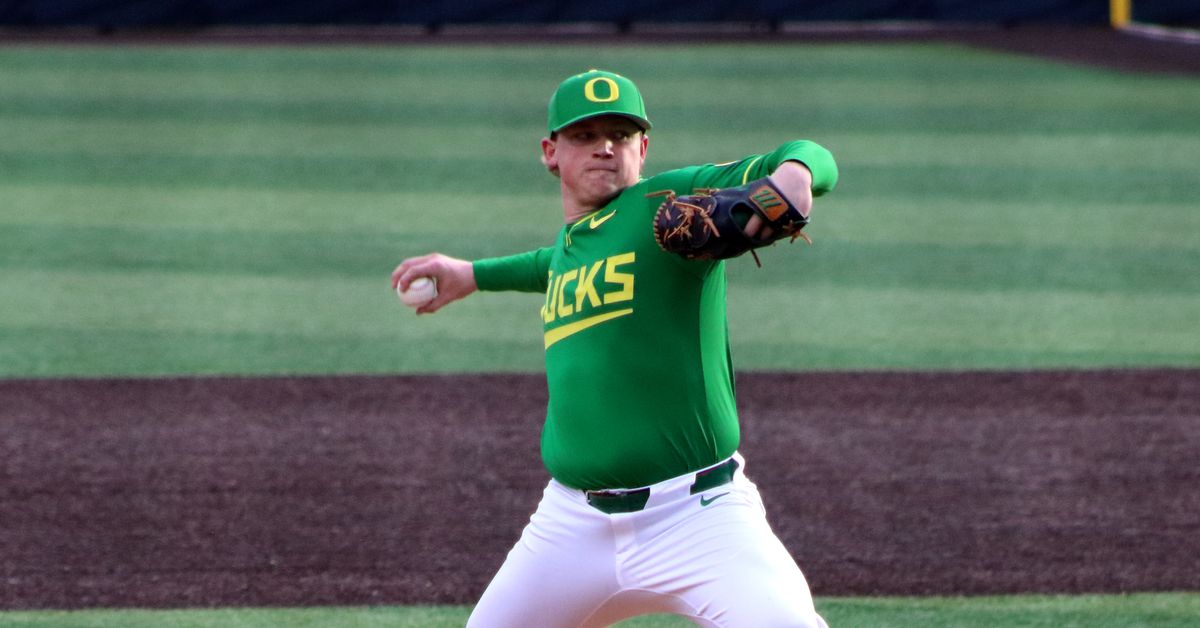
In 2025 Oregon generally used the same set of three starters during each three-game series. Grayson Grinsell and Collin Clarke were consistently on the mound for games 1 and 2, respectively. By the end of the season Jason Reitz had cemented himself as the go-to starter for day 3, but Iam Umlaudt also started a fair few games and pitched almost as many innings as Reitz. Because of this, I decided to treat all four as starters and compare them directly to their counterparts on CWS teams over the past 5 years (2021-2025). This means Grinsell was compared to pitchers with the greatest number of innings pitched for their team in a given season, Clarke to the second most, and so on. I then amalgamated all other pitchers with more than 20 full innings pitched on the season as a single “bull-pen” to compare depth as well.
Before I go through the results, here is a quick primer on the stats I decided to use for this article. Full formulas and more detailed descriptions can be found here.
ERA – Earned Run Average estimates how many runs a pitcher will surrender in the course of a given game. It is computed by taking the total earned runs a pitcher gives up, dividing by innings pitched, then multiplying by 9.
WHIP – Walks Plus Hits per Inning Pitched adds the total number of base hits and walks a pitcher gives up, then divides by the number of innings pitched. The result estimates how many players a pitcher will allow on base in a typical inning.
xFIP – Expected Field Independent Pitching attempts to produce a measure similar to ERA but that only depends on aspects of the play in a pitcher’s control. Essentially it tries to measure the number of runs a pitcher would give up if they had league average fielding on defense. Additionally, xFIP substitutes a league wide average of home runs per fly ball rather than using home runs directly. This is meant to adjust for pitchers whose home parks are easier to hit homers in.
SIERA – Skill-independent Earned Run Average also attempts to replace ERA with a statistic that is independent of the defense outside of the pitcher’s performance. The major difference between SIERA and FIP is that SIERA takes into account the type of hits a pitcher gives up, so pitchers who give up more pop-ups and grounders than line-drives will have a better SIERA than FIP.
So how did Oregon’s pitchers do in 2025 compared to their counterparts on teams who won super-regionals?
Grayson Grinsell 2025 vs. CWS First Pitchers
| Statistic | ERA | WHIP | xFIP | SIERA |
|---|---|---|---|---|
| Statistic | ERA | WHIP | xFIP | SIERA |
| CWS Median | 3.69 | 1.18 | 4.41 | 3.01 |
| CWS Std Dev | 0.96 | 0.20 | 0.86 | 0.86 |
| Grayson Grinsell | 3.01 | 1.01 | 5.13 | 3.2 |
Tristan Holmes and d1baseball.com
The raw numbers appear to show Grinsell is the kind of ace the Ducks need to make it to Omaha. The more advanced stats that attempt to correct for fielding and are less reliant on batter quality tell a different story however, about a full standard deviation in the wrong direction.
Collin Clarke 2025 vs. CWS Second Pitchers
| Statistic | ERA | WHIP | xFIP | SIERA |
|---|---|---|---|---|
| Statistic | ERA | WHIP | xFIP | SIERA |
| CWS Median | 4.35 | 1.33 | 4.83 | 3.58 |
| CWS Std Dev | 1.14 | 0.17 | 0.75 | 0.71 |
| Collin Clarke | 4.59 | 1.18 | 5.48 | 3.81 |
Tristan Holmes and d1baseball.com
Clarke is in a similar situation to Grinsell compared to his CWS peers. He fares better in SIERA than xFIP, so if one wanted to be kind they could say the defense has good chances to make plays on the hits he does give up. The fact his ERA compares poorly to the cohort is a splash of cold water to this line of thinking though. Closing with a happy thought, he will only be a junior in 2026 and may still have room to improve.
Jason Reitz 2025 vs. CWS Third Pitchers
| Statistic | ERA | WHIP | xFIP | SIERA |
|---|---|---|---|---|
| Statistic | ERA | WHIP | xFIP | SIERA |
| CWS Median | 4.36 | 1.31 | 5.15 | 3.63 |
| CWS Std Dev | 1.28 | 0.19 | 0.79 | 0.78 |
| Jason Reitz | 3.50 | 1.23 | 5.10 | 3.36 |
Tristan Holmes and d1baseball.com
Reitz is a welcome change of pace from what we have seen so far, comparing favorably to his counterparts in every measure I am tracking in this project. His numbers don’t show him to be truly elite, or even a game 1 starter for a team hoping to make it to Omaha, but he is a competitive game 3 option.
Ian Umlandt 2025 vs. CWS 4th Pitchers
| Statistic | ERA | WHIP | xFIP | SIERA |
|---|---|---|---|---|
| Statistic | ERA | WHIP | xFIP | SIERA |
| CWS Median | 3.76 | 1.30 | 5.13 | 3.64 |
| CWS Std Dev | 1.06 | 0.20 | 0.85 | 0.90 |
| Ian Umlandt | 2.55 | 1.37 | 5.76 | 4.25 |
Tristan Holmes and d1baseball.com
Well, we’re back to where we started. Umlandt’s ERA is quite good, but in addition to often being relief in Big Ten play he started a fair few mid-week games against weaker competition. The telling stat is SIERA where he is a full standard deviation on the wrong side of the median.
UO Bullpen 2025 vs. CWS Bullpens
| Statistic | ERA | WHIP | xFIP | SIERA |
|---|---|---|---|---|
| Statistic | ERA | WHIP | xFIP | SIERA |
| CWS Median | 4.29 | 1.37 | 5.06 | 3.54 |
| CWS Std Dev | 1.06 | 0.18 | 0.57 | 0.56 |
| UO Bullpen | 5.36 | 1.49 | 6.17 | 4.12 |
Tristan Holmes and d1baseball.com
Yuck. There is no denying the Ducks have a lot of work to do with their reserves if they hope to field a CWS caliber pitching staff. Every stat is on the wrong side of the median with SIERA more than a full standard deviation off and xFIP nearly two standard deviations away from the Omaha standard.
The Ducks four most used pitchers from 2025 all have eligibility left, offering stability if nothing else. Still, if there is a true ace is looking for a payday in the portal it would be worth Oregon’s time to try and put together a generous offer. Of greater importance is the bullpen. The Ducks need to improve both their recruitment and development of young pitchers if they hope to be truly competitive against national powers.
Share this content:
Author: Hey PDX
Hey PDX Team


Post Comment