Oregon Hockey: Season Recap – Addicted To Quack
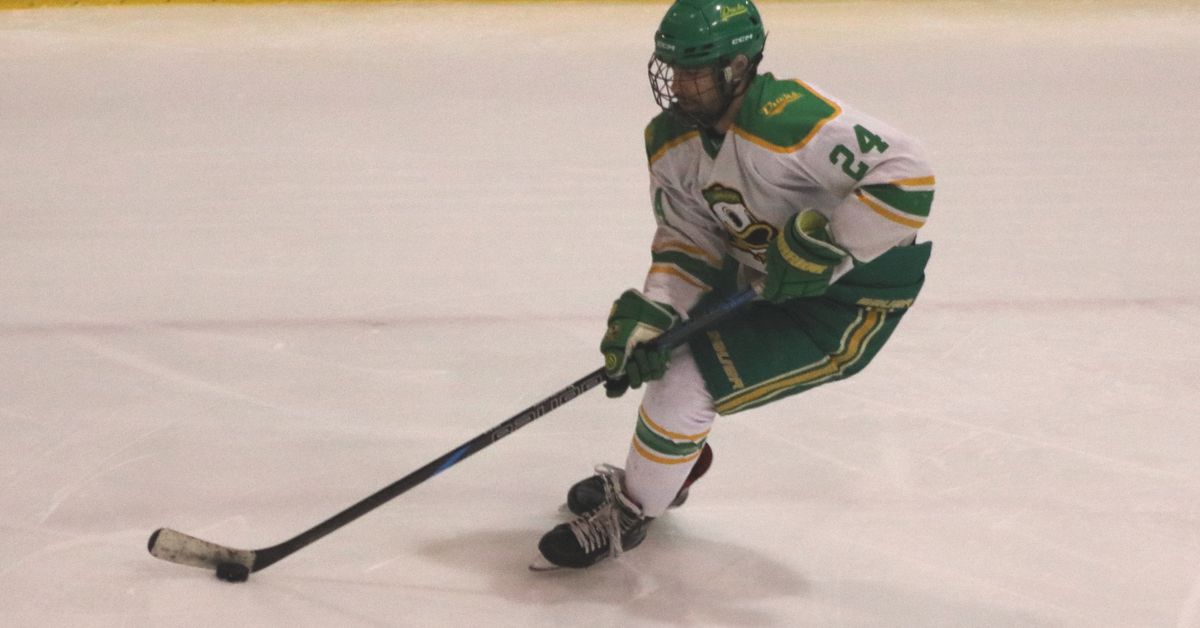
Putting a Bow on Oregon Ducks Hockey Season
It’s been a busy time here at Addicted To Quack. With both basketball teams making it to the NCAA Tournament and a plethora of spring sports in full swing, we’ve had a lot to cover. Now that there’s a bit more room in the schedule, I wanted to take the opportunity to put a bow on the hockey season, which wrapped up about a month ago.
This recap dives deeper into the five key stats I track when I’m able to watch Oregon Ducks hockey games. As a refresher, these include three team-based advanced stats and two traditional special teams stats:
Team Stats:
- Corsi% (shots for and against)
- High Danger Chances (HDC) – all situations
- High Danger Chances – 5-on-5
Special Teams Stats
- Power-Play % (Goals per PP attempt)
- Penalty Kill % (Goals allowed per opponent PP attempt)
I was able to watch 15 of the Ducks’ 22 games against Division 1 ACHA opponents. Here’s how those 15 games break down by opponent quality:
- Top 10 teams (UNLV and Utah): 4 games
- Teams ranked 20–25 (Arizona State Club and Colorado): 3 games
- Average teams (Colorado State and Iowa State): 4 games
- Lower-tier teams (Alabama and University of Rochester): 4 games
A Quick Guide to the Metrics
Team Stats (Corsi% & High Danger Chances):
55% = Excellent
- 52.1% – 54.9% = Good
- 48% – 52% = Even
- 45.1% – 47.9% = Bad
- < 45% = Terrible
Power-play (Penalty Kill is the inverse):
25% = Excellent
- 20% – 24.9% = Good
- 15% – 19.9% = Average
- 10% – 14.9% = Bad
- < 10% = Terrible
Season Overview (15 Games)
:format(webp):no_upscale()/cdn.vox-cdn.com/uploads/chorus_asset/file/25945308/Screenshot_2025_04_08_152517.png)
The Ducks went 4-9-2 in the games I tracked. Not a great record, but the underlying stats suggest they were closer to average than the record implies. So, what gives?
When a team’s record doesn’t match its stats, it’s usually due to one (or more) of three things:
- Lack of skilled shooters – creating chances but not finishing them
- Goaltending disadvantage – the opposing goalie outperforms yours
- Bad luck
In the Ducks’ case, I think all three played a role. The program is still learning how to build a roster that can consistently compete in ACHA Division 1. That takes time. But based on what I saw from the underclassmen, I believe this team is moving in the right direction.
Also, if you watched the same 15 games I did, you’d probably agree that the back-to-back home weekends vs. Iowa State and Alabama were just flat-out unlucky — only coming away with one win and one OT loss across four games.
Performance by Opponent Tier
Top 10 Teams (4 Games) — Record: 0-4-0
Not much to say here. Oregon faced national title contenders (UNLV and Utah), both of whom could go NCAA in the near future. These weren’t competitive games. High danger chance shares of 80–85% for the opponent are numbers you usually only see when Connor McDavid or Nathan MacKinnon play the Chicago Blackhawks.
The Ducks’ penalty kill actually looked respectable in these matchups — but that’s misleading. Given the lopsided score lines, it’s likely UNLV and Utah were easing off the gas late in games, showing a bit of mercy rather than pressing hard on the power play.
Ranked 20–25 Teams (3 Games) — Record: 0-2-1
These were more competitive games. However, the Ducks’ high danger stats are slightly inflated due to the 3-1 loss to Colorado, where they fell behind early and dominated puck possession late — after the game was largely decided. In that game, Colorado stopped attacking and focused on protecting the lead.
If we exclude that game:
- High Danger Chances (All Situations): Oregon – 18 | Opponent – 20 (47.36%)
- High Danger Chances (5-on-5): Oregon – 14 | Opponent – 14 (50%)
From the eye test, these games felt competitive. Oregon lost 3-2 to Colorado and 3-2 in OT to Arizona State — tight matchups that could’ve gone either way. It’s fair to say the Ducks were competitive against fringe Top 25 teams.
Average Teams (4 Games) — Record: 1-3-0
This is where bad luck really showed. From my view, Colorado State, Iowa State, and Oregon were on relatively equal footing in terms of talent. These were hard-fought games, and you’d expect a .500 record. Instead, the Ducks dropped three of four.
The Ducks also struggled at 5-on-5 high danger chances in this group, which is something to improve on next season.
The penalty kill was particularly brutal: 60%. In one game, they went 1-for-3 on the PK and lost by two goals. That’s a huge factor in the final outcome.
Lower-Tier Teams (4 Games) — Record: 3-0-1
If you want a positive takeaway from the season, it’s this: Oregon is clearly out of the basement. These games weren’t close — in Oregon’s favor this time.
Yes, they had one OT loss, but that was due to a superhuman performance by Alabama’s goalie. In that OT loss:
- High Danger Chances (All Situations): Oregon – 14 | Alabama – 9 (60.86%)
- High Danger Chances (5-on-5): Oregon – 12 | Alabama – 6 (66.67%)
Oregon would later sweep Alabama on the road, confirming that loss was a fluke.
The one nitpick? The power play could’ve been better in these games. One more goal here or there might have turned the OT loss into a win or made other wins more comfortable.
Final Thoughts
It’s hard to make a bold proclamation about where the Ducks are headed — this was my first season watching Oregon hockey, so I don’t have a baseline for comparison. But what I can say is this:
I genuinely enjoyed following and covering the team this year, and I hope you enjoyed learning more about Ducks hockey through these breakdowns. The program is clearly progressing, and I’m already looking forward to next season.
Let’s see where the road leads. Go Ducks.
Share this content:
Author: Hey PDX
Hey PDX Team


Post Comment